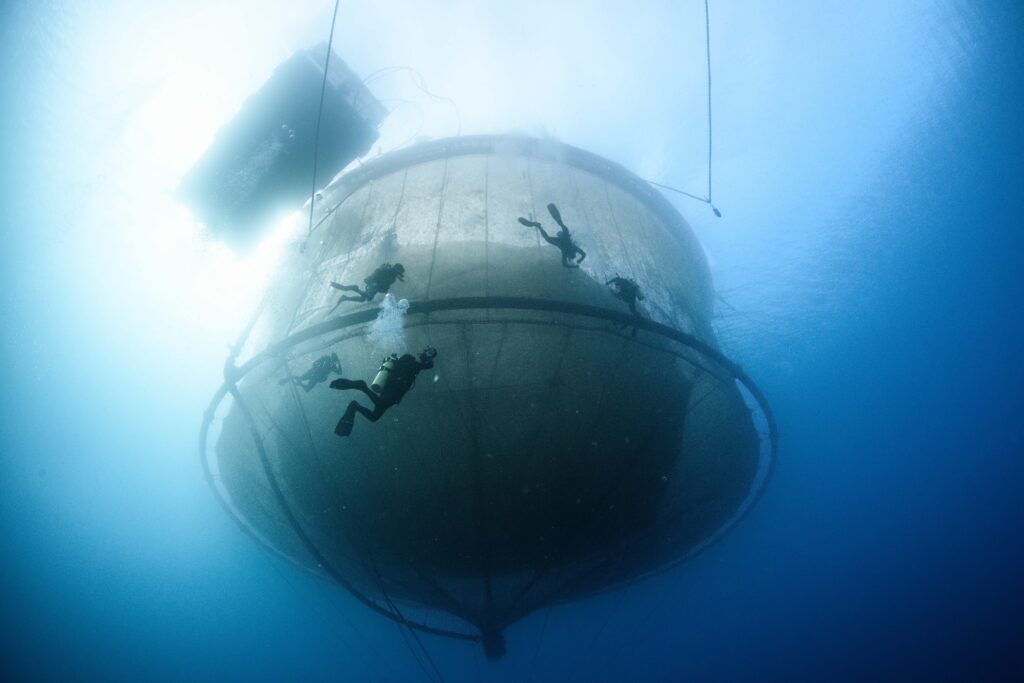
Water conditions dictate nearly every aspect of an open ocean aquaculture farm’s daily operations. While farm managers have long tracked it, this data is much more limited if it doesn’t capture the actual environment that the fish experience.
While it’s well known that conditions can vary significantly from one pen to another, it’s important to remember that the same can be true within the pen itself.
For example, fish at the top might be exposed to a materially different environment than those at the bottom. Without depth-resolved data, there is a risk of misinterpreting results based on incomplete information. Furthermore, when farms gain the advantage of fully submersible systems, this variance throughout the water column becomes an even greater factor as managers can select the most suitable depth for their stock.
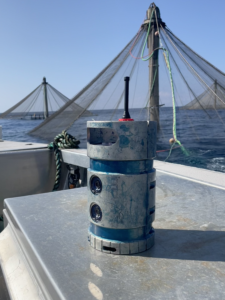
In this blog, we’ll explore three instances where depth-resolved data was essential for optimizing fish health and welfare. For each farm, Innovasea’s wireless aquaMeasure environmental sensors were deployed to capture real-time data at select depths.
#1 Protection below the thermocline
Extreme heat can make surface water conditions untenable for fish. To mitigate this, farms can submerge net pens to a suitable depth. However, this makes surface temperature readings less reflective.
To understand this, a farm operating in the Red Sea positioned temperature sensors at both the top and bottom of a fully submersible pen, located at a depth of 45 feet.
The first was placed at a depth of 45, and the second at 75 feet. These two reference points, spaced 30 feet apart, were used to indicate the vertical temperature profile. This approach allowed the farm team to directly assess conditions, including the impact of weather and water column dynamics, where the fish were located.
In the following graph, you can see the significant difference in temperature at various levels. The dark blue line indicates surface temperature, while the light blue and green lines show temperatures recorded at the top and bottom of the pen, respectively.
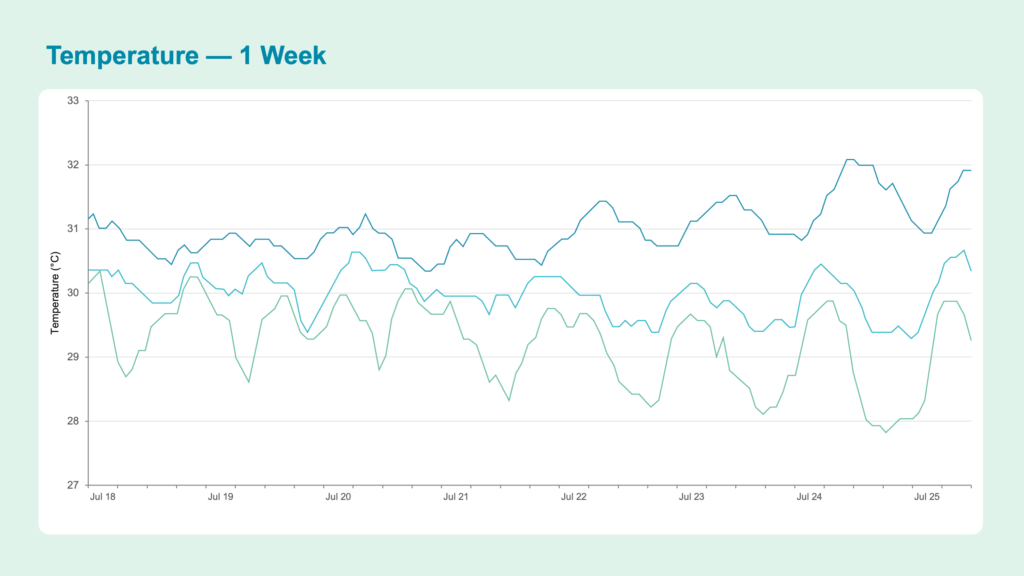
Graph 1: The temperature data shows the relationship between surface conditions and the environment experienced by the fish inside the pen. Dark blue indicates surface temperature while the light blue and green show temperature at the top and bottom of the pen.
During periods of warmer, more variable weather, surface temperatures increased rapidly and showed greater short-term fluctuations. In contrast, temperatures within the pen rose more gradually and remained comparatively stable, creating a clear and sustained temperature difference between the two depths.
This separation highlights the buffering effect of water depth, which moderates the intensity and rate of temperature change experienced by the fish.From a farm manager’s perspective, this information is critical.
Strong thermoclines can constrain the vertical distribution of fish and influence behavior, appetite, and stress sensitivity. Using real-time sensor data to confirm pen temperatures, farms can make confident, data-driven decisions around feeding strategies, handling intensity, and operational planning, even during periods of elevated surface heat.
What’s more, the data demonstrates that a short duration of surface temperature spikes do not necessarily translate into immediate thermal stress as submerged pen-level conditions remain buffered and stable.
#2 Accounting for seasonal temperature stability
Water temperatures aren’t uniform year-round, and for farms to be effective it’s essential to monitor and account for this change. To further explore this point, we return to the farm mentioned in example one.
As a reminder, the farm is in the Red Sea, and they are operating fully submersible pens at a depth of 45 feet. As conditions became more stable, the gap between surface and pen temperatures narrowed, as shown in graph 2.
This convergence indicates improved vertical mixing and more uniform thermal conditions around the fish. From a husbandry perspective, this information supports measured feeding and handling decisions, as large and rapidly changing temperature differences can increase metabolic stress and reduce feeding consistency.
The temperature sensors therefore provide confidence that fish are being exposed to a stable environment, even when surface conditions fluctuate.
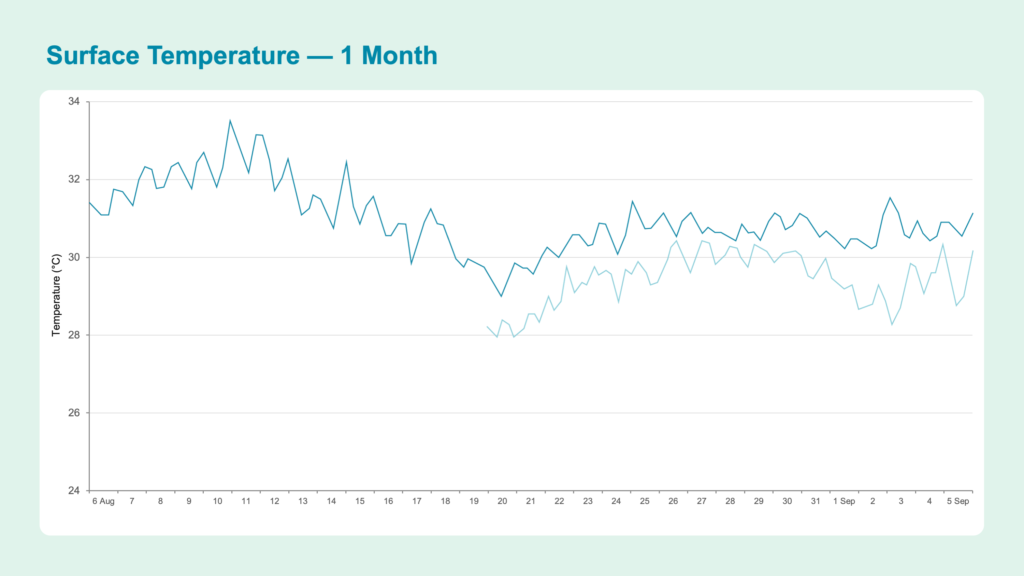
Graph 2 shows surface temp (dark blue) and pen temp (light blue). The difference between temperatures is significantly less in the fall than the summer .
#3 Using dissolved oxygen (DO) as an indicator for net cleanings
Net cleaning is a vital, yet time-consuming process for aquaculture farms. Rather than guessing when accumulated biofouling is impacting fish health, DO sensors can deliver a quantitative assessment of its impact on the pen environment.
The graph below shows the DO level pre- and post-cleaning of the nets, which had accumulated significant, visible biofouling over the summer period. The red line represents DO conditions before cleaning, the blue line is post-cleaning, and the green line shows surface conditions.
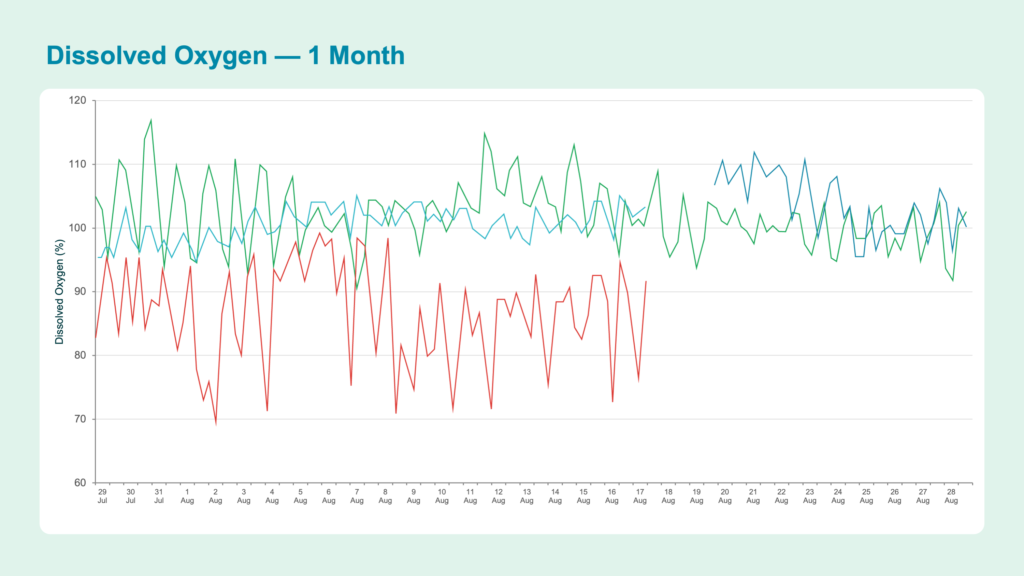
Graph 3 illustrates these changes inside one of the pens, with the red line representing conditions before cleaning and the blue line showing the improved values afterward.
Prior to cleaning, DO levels inside the pen showed increased variability and a gradual downward trend, consistent with restricted water flow caused by biofouling on the nets.
Following a thorough cleaning, a clear improvement in water quality was observed. Additionally, post cleaning, DO levels remained stable and closely aligned with surface conditions, indicating a successful and lasting outcome.
From a husbandry perspective, this sensor-validated response is critical.
While net cleaning is a routine activity, the DO data provide objective evidence that the intervention directly improved the environment experienced by the fish. This confirmation supports the continuation of normal feeding practices and reduces the risk of oxygen related stress.
In this context, the DO sensors function not only as monitoring tools but as validation instruments, ensuring that husbandry actions are effective and delivering the intended biological benefit.
Evoking the power of real-time data
Accurate, real-time data (24/7) can help farm managers move from gut-based to data-driven practices. Applying these insights at each step of the production process will help streamline operations, support timely adjustments, and lead to repeatable, scalable output.
Ready to learn more?
Talk to a member of the Innovasea team today to see how we can help with your next project.
Contact Us Erik Vis, who is part of Innovasea’s Aquaculture Services department, brings hands on aquaculture knowledge and experience to the team. He holds an MSc in Aquaculture from Wageningen University in the Netherlands and an MBA from the Norwegian School of Economics (NHH).