Fathom Software
Comprehensive collection of cloud-based fish tracking tools provides deep visibility into your data
Fathom is a collection of web-based applications that make storing, managing, visualizing, analyzing, and sharing your acoustic telemetry data a breeze – whether you’re sitting at your desk or out in the field.
Simplify study management
Fathom is a collection of web-based applications that make storing, managing, visualizing, analyzing, and sharing your acoustic telemetry data a breeze – whether you’re sitting at your desk or out in the field.
Fathom is everything you loved about VUE software and so much more.
The ultimate tool for telemetry research
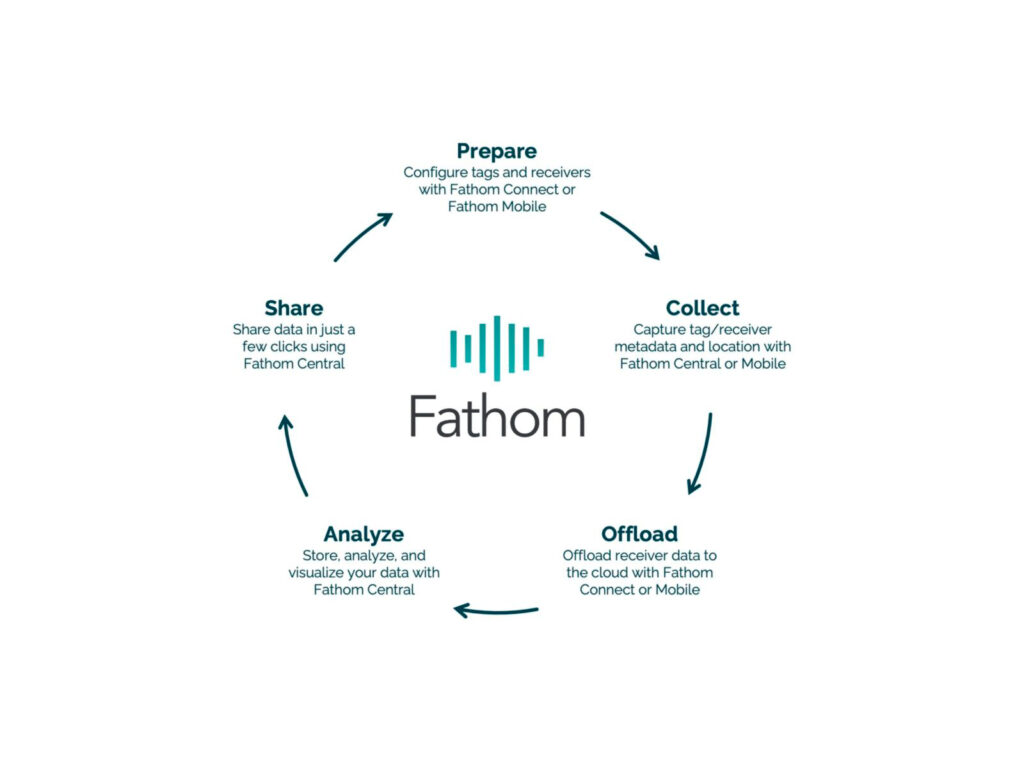
From planning to analysis, discover how Fathom’s core applications– Connect, Central, and Mobile– can help you get the most out of your research.
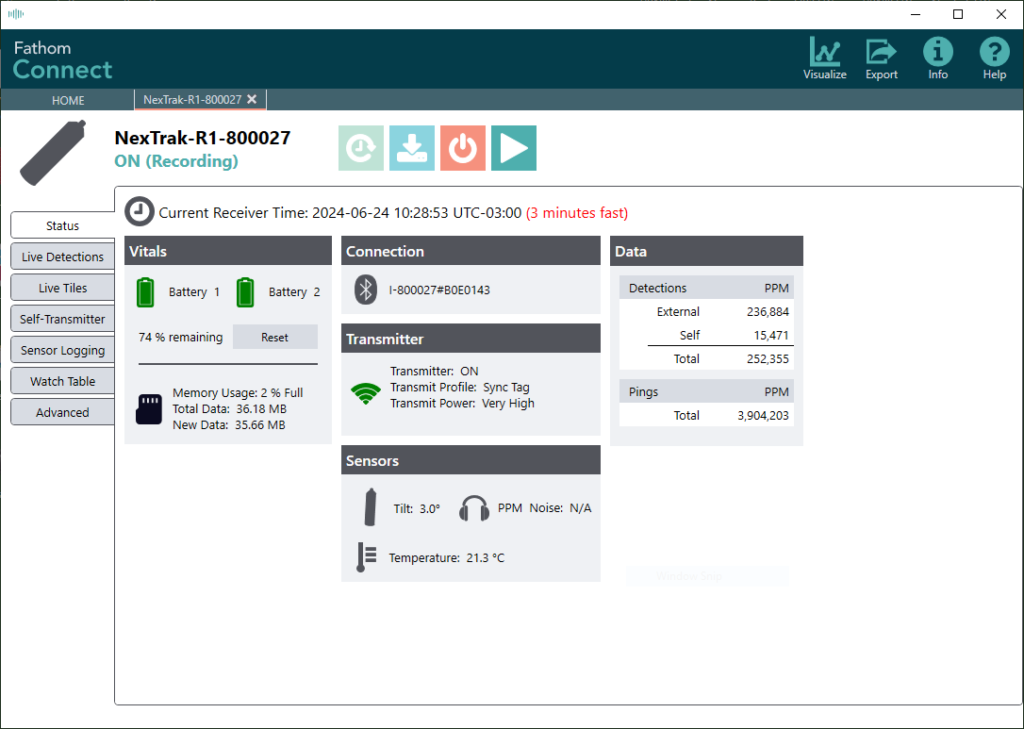
Offload data from your desktop
Fathom Connect lets you configure, initialize, and offload data from Innovasea receivers from your desktop, and even perform simple data visualizations.
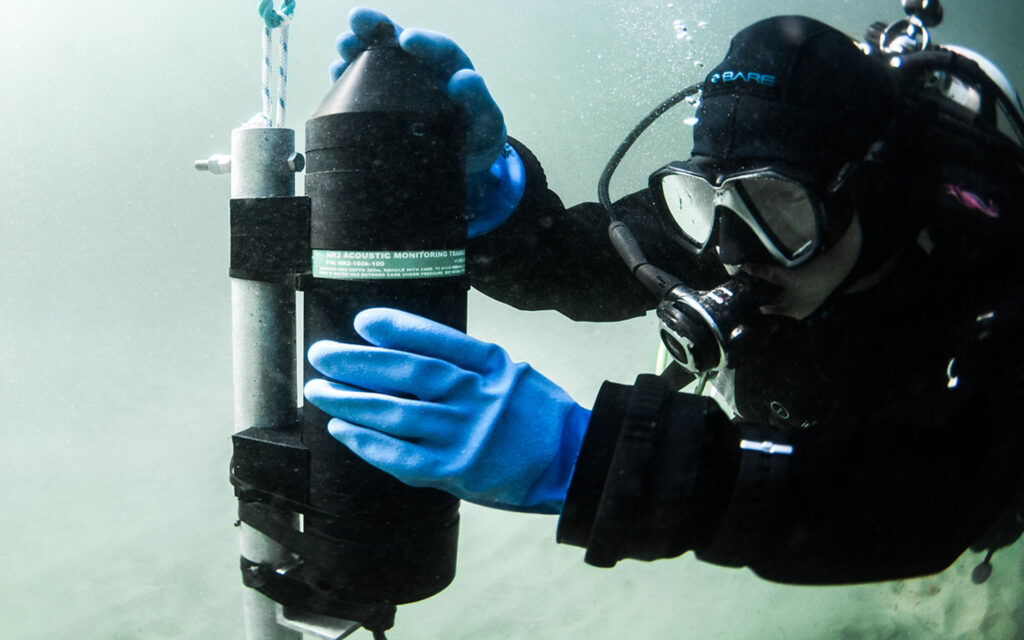
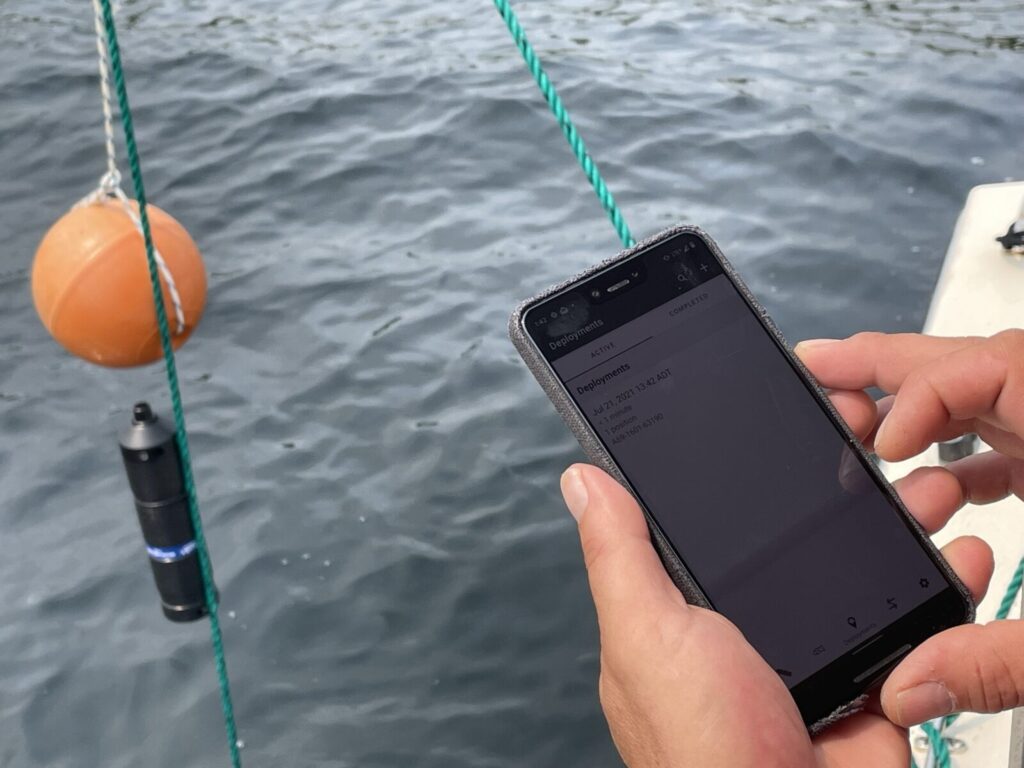
Access receivers from your mobile device
Use your Android mobile device to connect to, initialize, and offload your VR2-family receivers, record deployment locations, and keep track of animal tagging metadata.
Watch this video to connect to your VR2 receiver with Fathom Mobile (underwater!)
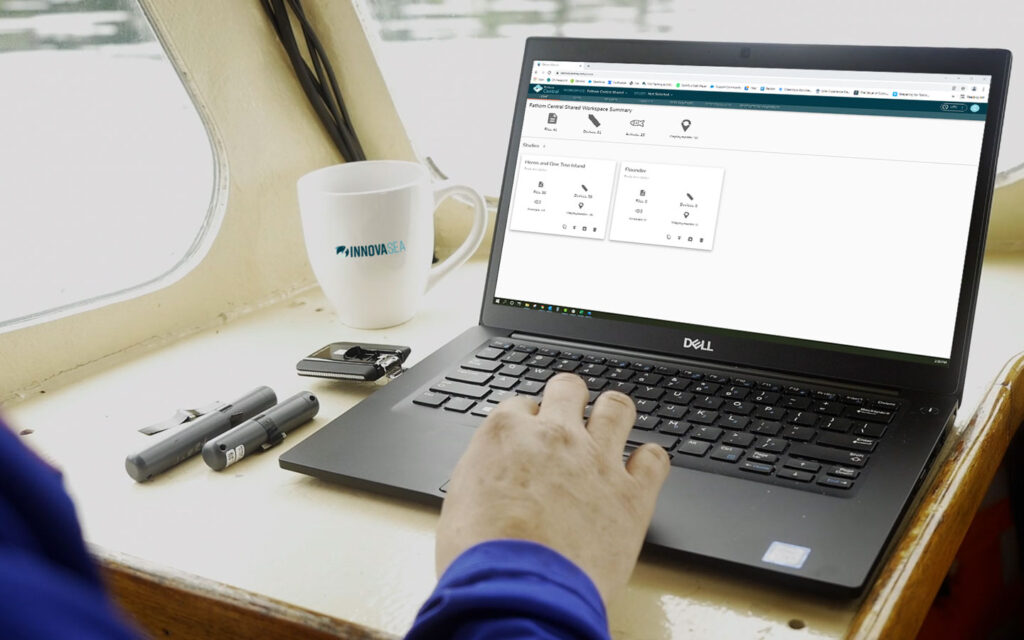
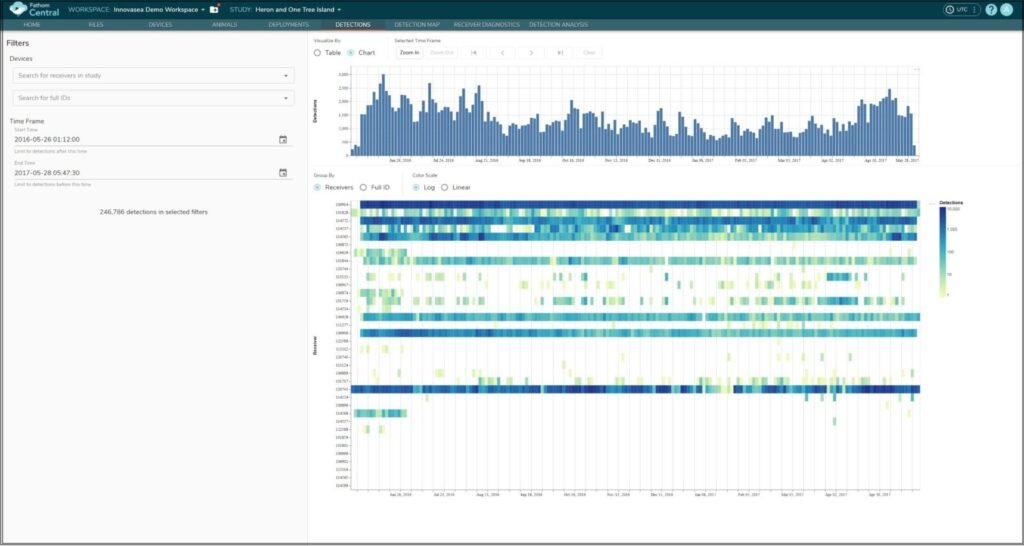
Manage data in a single hub
Fathom Central is a cloud-based storage hub for saving, managing and visualizing your acoustic telemetry data. It provides simple online tools to help with all phases of your study and helps you quickly prepare detection data and metadata for export to telemetry networks.
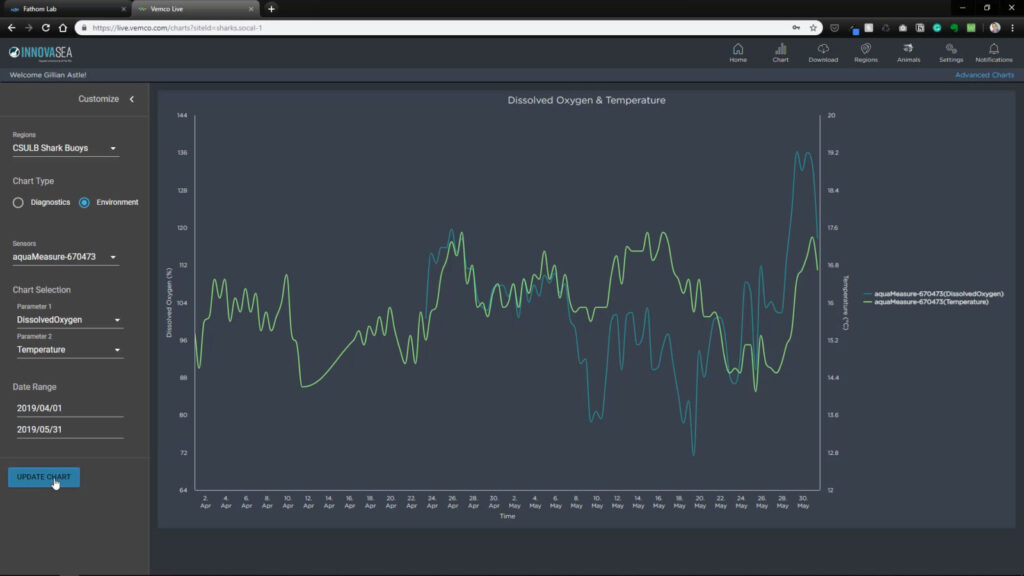
Go deeper with premium add-ons
- Fathom Live* gives you real-time notifications about animal detections and environmental conditions and provides charting tools to help you visualize and interpret data quickly and easily.
- Fathom Position* lets you perform your own fine-scale positioning and generate your own animal tracks at any time – which is ideal for conducting multiple, short studies – and access your data from anywhere.
*Paid subscription required
I usually conduct downloads every six months…so using the mobile app on the tablet has saved a lot of time. Plus, I don’t have to worry about having my computer out on the boat. Using the mobile app has been wonderful.